PAN Results
PAN Filter Results
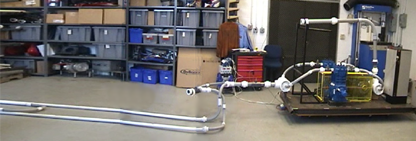
We set up an air compressor rig to demonstrate the effectiveness of a PAN Filter. Watch a video demonstration of the air compressor rig and how a PAN Filter dramatically reduces wave pulsations.
PAN Hi Performance Manifold Results
We used Virtual Pumping Station to create a baseline model of a real pumping station with bottles. We calibrated the model to accurately simulate the performance of the compressor at all speeds and load steps. Next, we removed the bottles from the model and replaced them with an initial PAN design. Then, we optimized the geometry of the PAN to minimize pulsation and maximize compressor efficiency. Here are our results:
Suction and Discharge Pressure and Pulsation Comparisons
Virtual Pumping Station software can display pulsation at different locations along the piping. The Orange line shows the large pulsations at the Cylinder Flange of the Compressor. Note that after the TST 3-into-1 junction, these amplitudes have been reduced greatly. After a second Wye TST junction, the pulses that reach the pipeline are minimal (Green line) and safe. Click the graphs for a larger view.
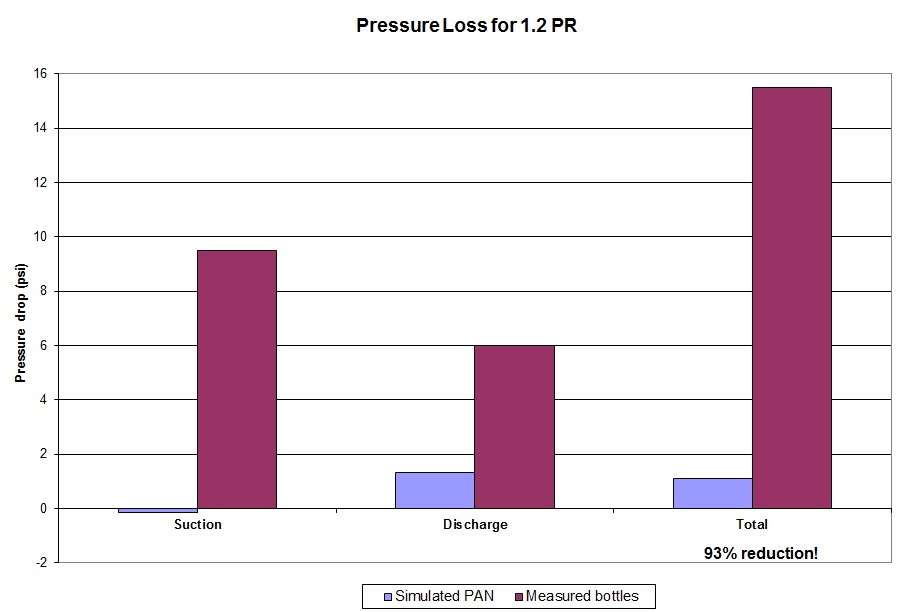
Pressure Loss Comparison
Because of the choke tubes and orifice plates used in a typical bottle configuration, an adverse effect of their pulsation reduction is a dramatic loss of pressure. Prior to PAN technology, it was thought that this pressure loss was necessary in order to reduce pulsation. But unrestricted PAN manifolds allows us to reduce pulsations with negligible pressure loss. Click the graph for a larger view.
PAN Hi Performance Manifold Diagram